The article below is an excerpt from a recent edition of Bitcoin Magazine PRO, Bitcoin Magazine’s premium markets newsletter. To be among the first to receive these insights and other on-chain bitcoin market analysis straight to your inbox, subscribe now.
Aug. 17, marked the return of the much-awaited and notorious bitcoin volatility. After several months of consolidating around the $30,000 level with historically low realized and implied volatility in the bitcoin market, the price finally awakened, bringing about the biggest liquidation event bitcoin has seen in years. Contrary to some opinions by reporters and analysts, the bitcoin crash was not triggered by rumors of SpaceX selling bitcoin or any other news-based event. Unlike a stock, bitcoin doesn’t have earnings calls or bad news about future prospects that can tank the price or dampen the network’s fundamentals.
Yes, events such as the approval (or dismissal) of a spot bitcoin ETF could change the market’s expected flows, but this was not the case during Thursday’s price crash. Instead, the market move was a good, old-fashioned derivative liquidation, a simple instance of more sellers than buyers, with the resolution being a price-clearing mechanism to the downside.

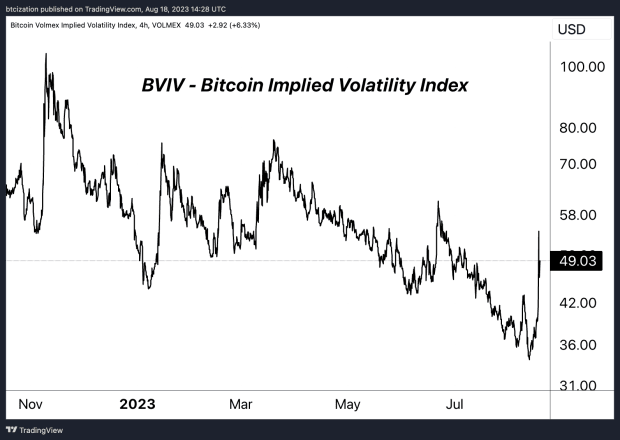
In previous issues, we wrote about bitcoin’s historically low realized and implied volatility, noting that such periods lead to large bounces in volatility and explosive breakouts in either direction. Obviously, the recent resolution was to the downside, but it could lead to a new regime in bitcoin, at least temporarily, as the market attempts to find a new equilibrium in the short-to-intermediate-term.
Since this was largely a derivative phenomenon, let’s explore some of the mechanics behind this massive move. In bitcoin, while the options market is less developed and mature compared to equities, there has been growth relative to the futures market in recent years, and growth in both markets compared to the spot market since 2017. It’s important to note that the proliferation of a futures/derivatives market isn’t necessarily good or bad. With an equal amount of long and short positions, the net impact over a long enough time frame is neutral. However, in the shorter-to-medium term, a developing derivatives market on top of the spot market can lead to large dislocations that result in unexpected volatility, with the market trading aggressively in one direction or the other to resolve the imbalance.
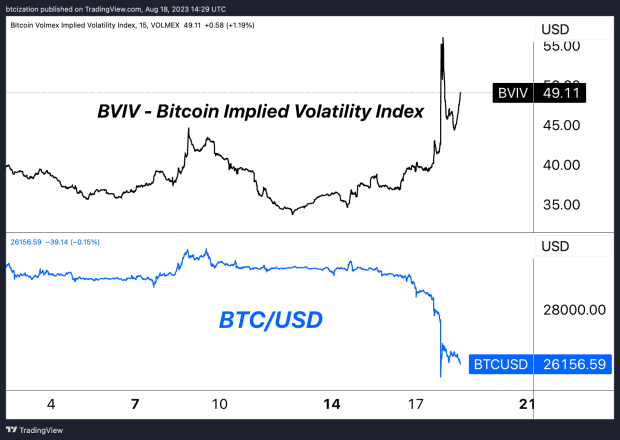
When observing a period of downtrending implied volatility derived from pricing in the options market, we can see what traders and speculators think an asset’s future volatility will look like. Short volatility strategies, whether simple or complex, are essentially bets on lower and/or stagnant volatility in the future. In this case, observing the trend in bitcoin’s implied volatility through the Volmex Bitcoin Implied Volatility Index (BVIV), we can conclude that selling or shorting volatility became a popular trade over the summer months, effectively restricting the bitcoin market to a given price range.
When market participants sell volatility through options, market makers respond by adjusting their hedges in the underlying asset, creating a stabilizing “pinning” effect near certain price levels where there is substantial open interest. To maintain a neutral position, market makers dynamically buy or sell the underlying asset in response to price movements of options, reinforcing the pinning effect. This equilibrium, however, can be shattered by unexpected events or shifts in sentiment, causing market makers to rapidly re-hedge. This leads to a sudden and significant price and volatility movement, reflecting the delicate and interconnected nature of options trading, market making and asset dynamics. This is precisely what occurred.
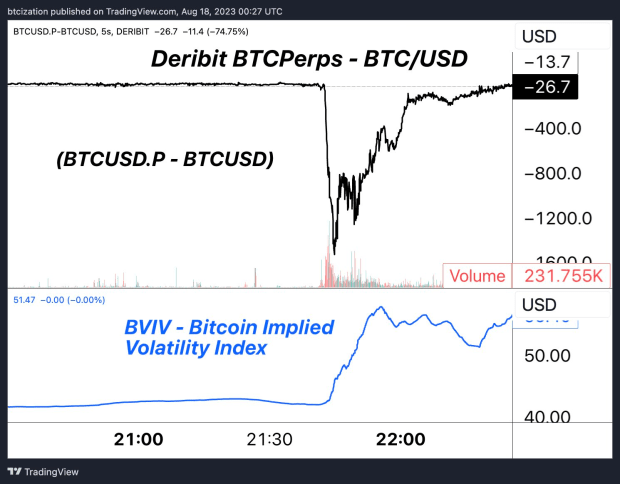
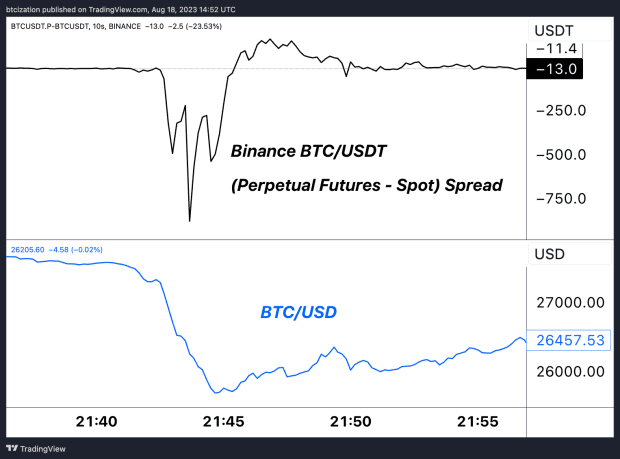
Looking at Deribit, the primary options marketplace for bitcoin/crypto, the spread between their perpetual swaps market and the spot bitcoin market widened massively as implied volatility expanded. Participants who had been making money by shorting or selling volatility were caught unexpectedly, leading to a massive dislocation and liquidation event.
All that being said, this wasn’t just an options-driven event. There was growing leverage in the futures market as well. Spot market volumes at multi-year lows combined with growing derivative volumes and open interest in addition to volatility near multi-year lows, was akin to lighting a match near a pile of dynamite and waiting for ignition. Alas, a spark was lit.
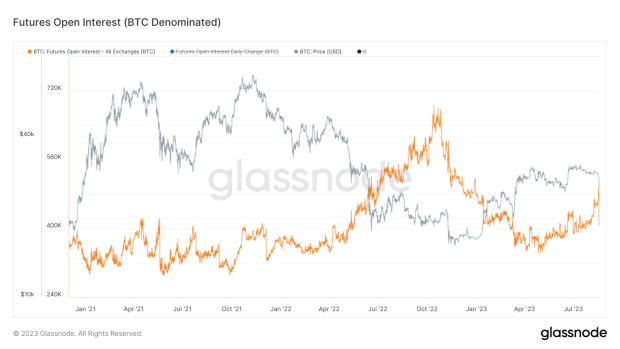
In bitcoin-denominated terms, the daily change in open interest was larger than the collapse of FTX, with 89,000 BTC less open interest than 24 hours prior.
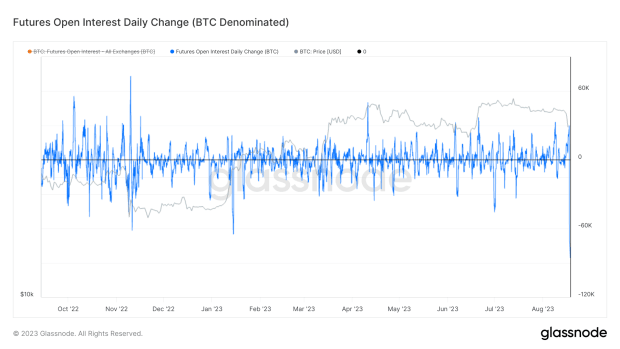
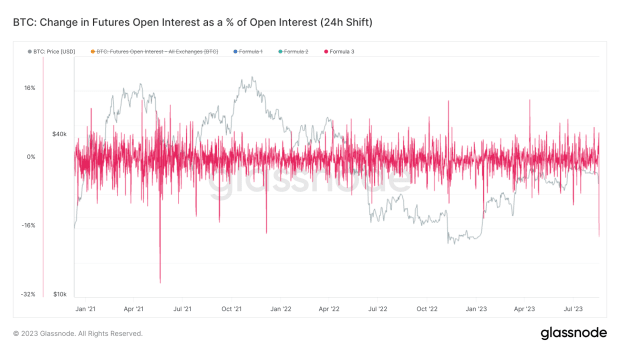
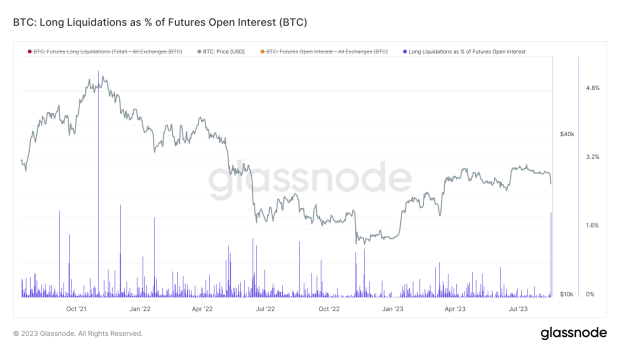
As a percentage of the futures market, with a 24-hour period to match up the timelines, the move was equivalent to 18% getting wiped out or closing, something that hasn’t been seen since December 2021.
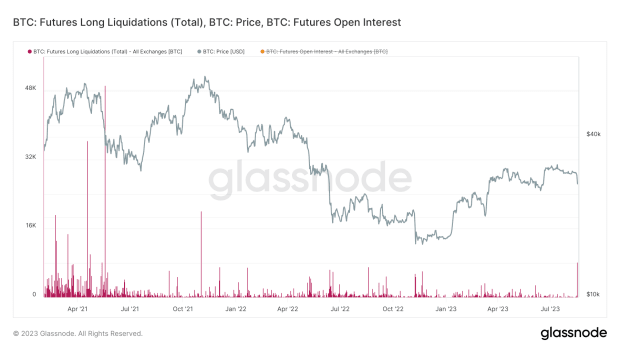
Looking only at open interest liquidations, Glassnode finds 8,141 BTC getting liquidated during Thursday’s move, the largest since November 2021, and approximately 2% of open interest that forcefully got liquidated or margin called.
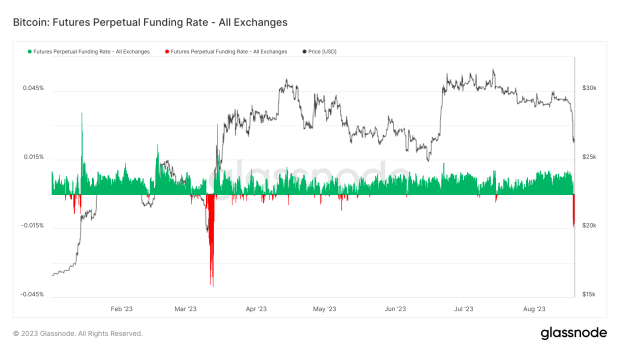
Taking a look at funding rates — the variable interest rate paid between long and short positions in the perpetual futures market to incentivize traders to keep the contract price close to the spot market — funding fell to its lowest level since the March banking crisis when Silicon Valley Bank failed and USDC depegged. This shows just how large the dislocation in the derivatives market was relative to the spot market. While it’s too early to draw conclusions about a significant short bias in the market due to the negative funding rate, we will monitor the market over the coming days and weeks. A period of sustained negative funding with rising open interest could bring about conditions conducive to a short squeeze, although this has yet to develop.
Final Note:
In conclusion, while Thursday’s move was the largest bout of volatility seen all year and the largest bitcoin derivative-driven phenomenon in quite some time, it is typical of periods of extremely low realized and implied volatility in any market, let alone that of a notoriously volatile and unpredictable digital asset still in its monetization phase. In the short term, we now expect a pickup in volatility and greater uncertainty as the price tries to find a new equilibrium point, with plenty of news ahead regarding potential bitcoin spot ETF approvals heading into 2024.
That concludes the excerpt from a recent edition of Bitcoin Magazine PRO. Subscribe now to receive PRO articles directly in your inbox.


